

In recent years, the information processing industry has evolved dramatically. The Big Data revolution, propelled by academic papers such as Google’s NFS, Map Reduce, Pregel model, coupled with the emergence of Hadoop and many other technologies which would be unfair not to mention if we are to make a list of all the technologies that have emerged, make the analysis of data possible at new levels, in terms of volume and speed. One of the most enticing areas with multiple fields of application is graph processing: The structural study and content of social networks, fraud detection, recommendation systems, logistics and transport analysis, just to mention a few, are very attractive areas for this type of analysis. With this article, we want to start a series of posts on how to use Stratio Data Centric to solve problems that involve the analysis of large graphs.
Techniques
Graph processing can be divided into two main categories:
- Transactional online graph persistence (based on OLTP): in this category we find graph-oriented databases that allow analysis in real-time through queries, giving answers to multiple services and applications. Social networks, recommendation systems, messaging and transport systems are the main fields of application of transactional operations on graphs. It should be noted that systems based on transactional analysis can, as well as retrieving explicit information, execute higher levels of processing, with the ability to provide a solution to the Page Rank algorithm and others whose main characteristic is the use of graph traversal. Nonetheless when we require the execution of more complex iterative algorithms or the combination of different sources of information, the use of calculation engines becomes essential.
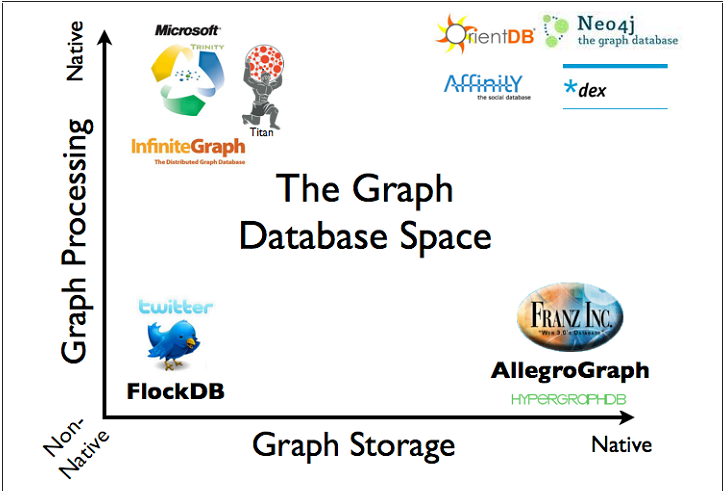
There are two main characteristics to evaluate in a graph database: its storage layer – whether it uses native graph storage or it employs other models such as relational, which is oriented to documents or objects – and the type of logic it employs to guarantee it metes compliance with a CRUD interface. Figure 1, taken from Graph Databases, shows a graphical summary of the existing technologies grouped by the aforementioned criteria.
- Offline graph analytics (based on OLAP): it mainly employs the so-called graph compute engines, among which Giraph, Graphx and Gelly stand out. The reduction of manufacturing costs of RAM memory has highlighted the in-memory calculation against the classic MapReduce techniques. The calculation of centrality metrics such as closeness and betweenness, community detection as well as the prediction of their evolution are some of the tasks on which the use of these tools is centred.

Previous distinction notwithstanding, graph processing systems involve tools of the two classes, which complement each other: storage technologies are used as sources of information while calculation engines are able to combine different sources and perform tasks whose results can be used to update the information stored.
The creation of a system for graph analysis faces numerous challenges, among which we will highlight the following:
- Partitioning problem: When we talk about horizontal scalability, it is very important to solve the problem of data partitioning. Nowadays, this is the main difficulty faced when working with distributed graphs. This happen because a prediction can’t be made regarding how the relationships between the different vertices will be, which then makes it difficult to parallelize in the most optimum way, retrieve information or execute the algorithms. So far we are not aware of any technology that solves this problem. While it is true that many databases are able to scale and handle ever-increasing volumes of read/write data, thanks to replication, the effectiveness with which complex queries are performed on partitioned graphs, navigating the relationships between the vertices is made increasingly lower, having to query a greater number of nodes in the cluster. Specifically speaking, sharding is an antipattern in graph based databases and getting rid of this problem will take years. The best reccomendation is to make a distribution through schema, physically separating the information and minimizing the possibility of owning related vértices in different nodes within the cluster.
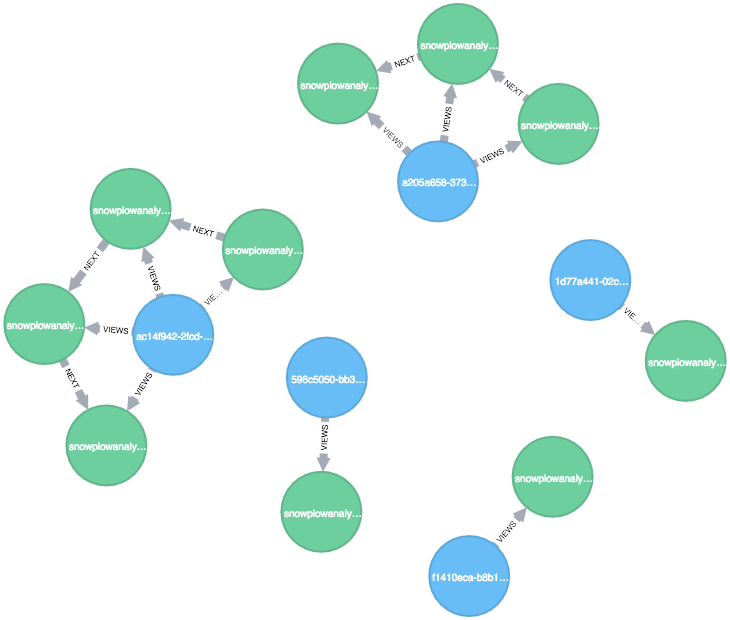
- Visualization problems: Graphs are abstract structures with a strong visual component. This is one of the characteristics that makes them very attractive for specialists in information analysis. However, the volume of vertices and arcs involved can be overwhelming, even in a medium-sized graph. Many graph visualization algorithms have been developed which optimize the representation space or highlight the information that is relevant when visually representing a graph. Among the best known visualization algorithms are those based on force and layered algorithms.
- Dimensionality problem: Closely linked to visualization techniques, the reduction of dimensionality tries to simplify the task of graph analysis, taking the largest load of structural information or content employing the least amount possible of data (vertices and arcs).
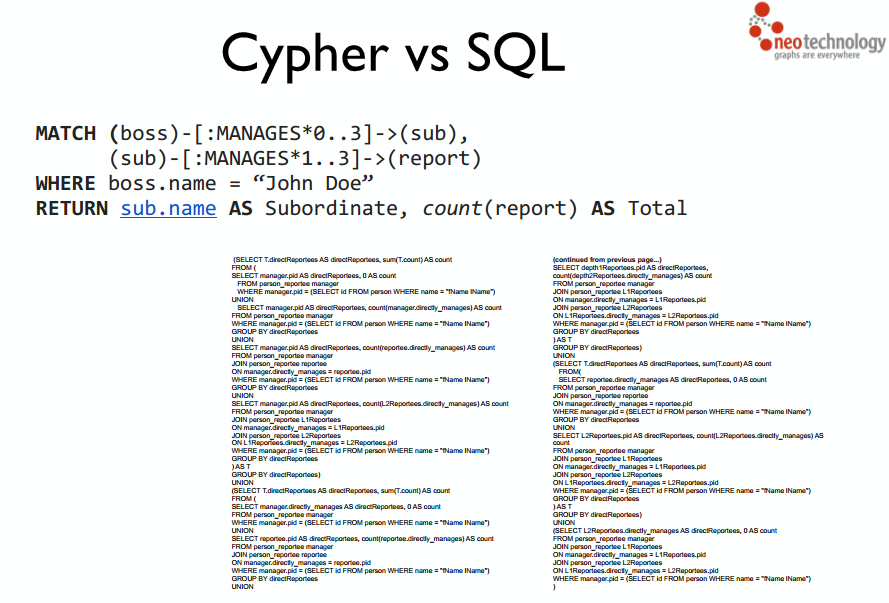
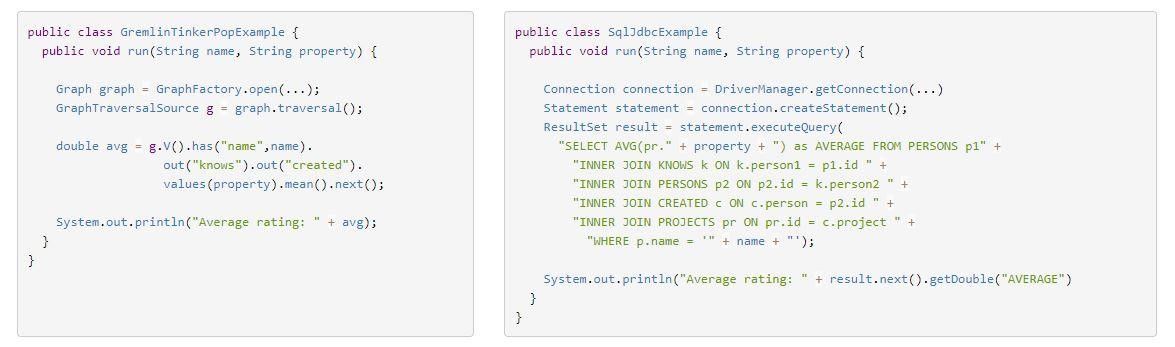
- Data query problem: The most extended language for data query is SQL, a very powerful language that has no match when it comes to searching structured data. Many NoSQL databases provide an interface in this language to be more friendly user in the interaction with these new technologies. However, SQL is not optimized for the query of data which is linked, many SQL lines can occupy more than one query in languages typical of graph-oriented databases. Cypher from Neo4j, Apache Gremlin and Tinkerpop Project are the most popular query languages –although in the case of Cypher we should clarify that it is highly optimized for queries in Neo4j.


Among the efforts made by the community to create standards for graph processing, we highlight Apache TinkerPop. TinkerPop is a framework that tries to offer unified interfaces both for OLAP and OLTP over graphs. TinkerPop is conmposed by the following modules:
- Blueprints: Blueprints is an interface for modeling property graphs. Technologies that implement the Blueprints interfaces are automatically compatible, allowing either to be swapped indistinctly.
- Pipes: It allows you to create data flows concatenating operations on vertices and edges. They allow division, fusion, loop and, in general, transformation of data from input to output.
- Gremlin: It is a specific domain language for cross-reference on property graphs based on Gruby. Gremlin uses Pipes to perform complex queries on the technologies that implement the Blueprint interfaces.
- Frames: It exposes the elements of the Blueprints interfaces as Java Objects, which allows writing the software of terms of objects and their relations instead of vertices and edges.
- Furnace: It is a compilation of graph algorithms implemented under the use of Blueprints interfaces, which allows them to be used with any technology that supports these interfaces. It integrates natively with Gremlin through the use of Pipes.
- Rexster: It allows exposing any technology that implements Blueprint interfaces through HTTP/REST protocols and a binary protocol called RexPro.

Among the technologies that have implementations compatible with Tinkerpop we find the following:
- TinkerGraph in-memory graph
- Neo4j graph database
- OrientDB graph database
- Titan graph database
Original source: http://tinkerpop.apache.org/

In future posts we will employ the terminology laid here to implement use cases of Graphs in Big Data with the Stratio data-centric platform.


